“extremely user friendly”
“truly amazing!”
“so easy to use!”
 Statistics Calculator
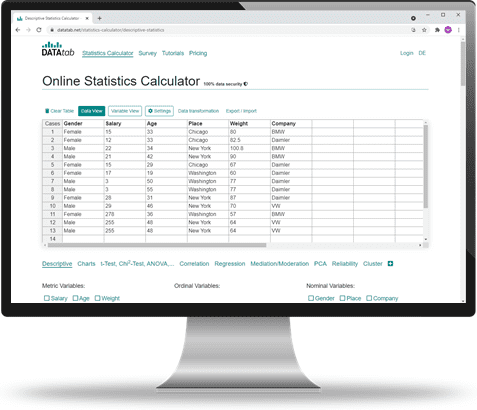
You want to analyze your data effortlessly?
DATAtab makes it easy and online.
 Insert data
Copy your data into the statistics calculator.
Copy your data into the statistics calculator.
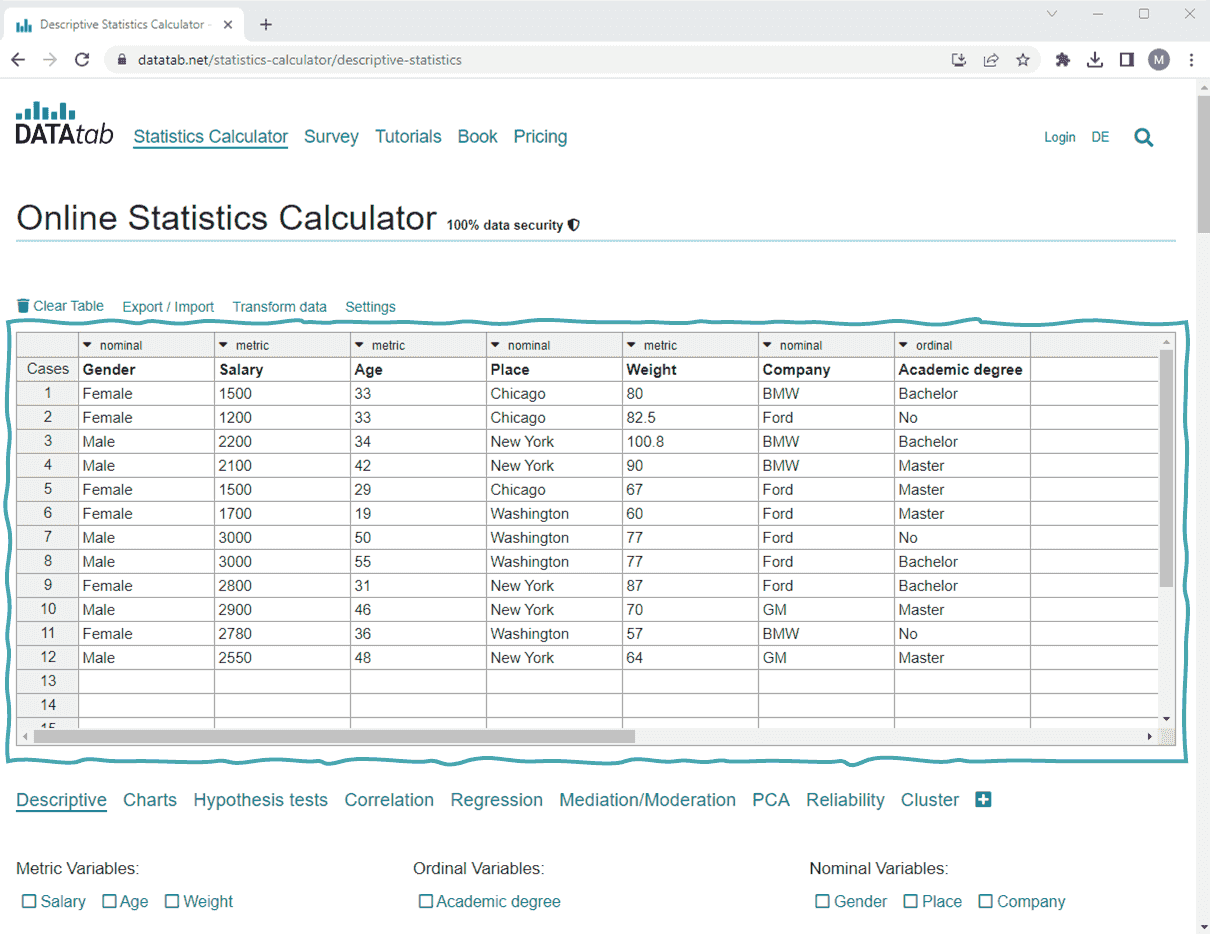
 Select area
Choose what you want to do with your data.
Choose what you want to do with your data.

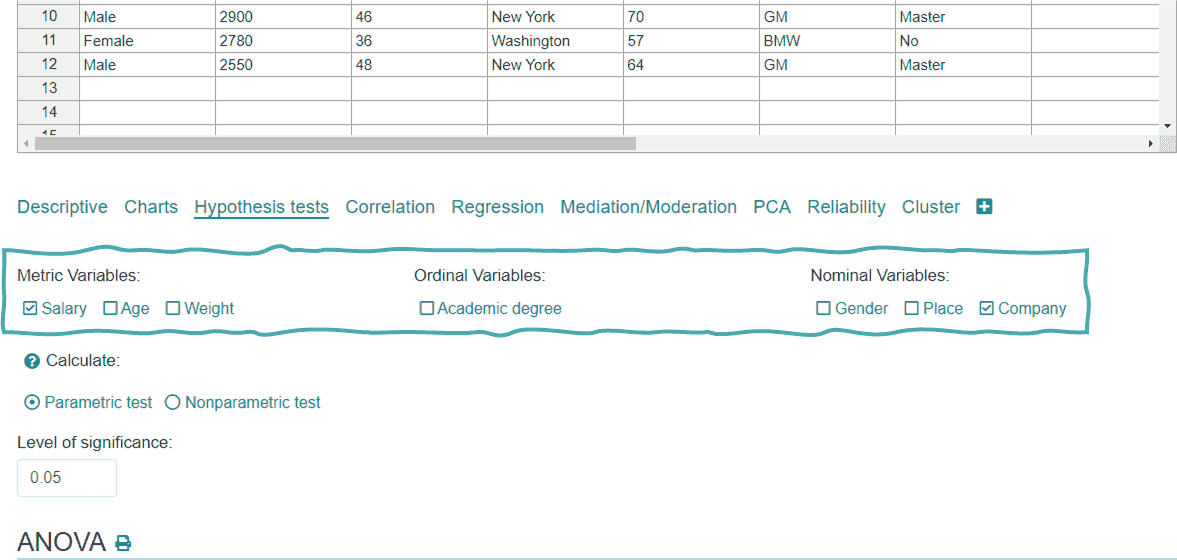
 Select variables
Select the variables that interest you.
Select the variables that interest you.
 Ready!
DATAtab selects the appropriate method and interprets your results.
DATAtab selects the appropriate method and interprets your results.
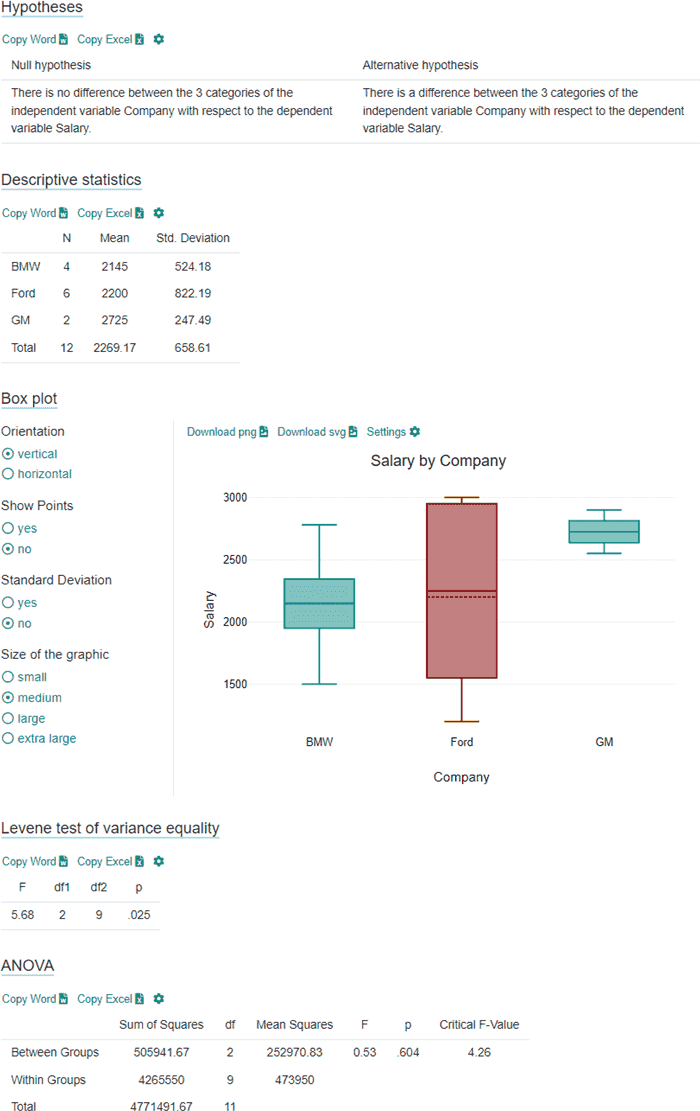
Online Statistics Calculator
What do you want to calculate online? The online statistics calculator is simple and uncomplicated! Here you can find a list of all implemented methods!
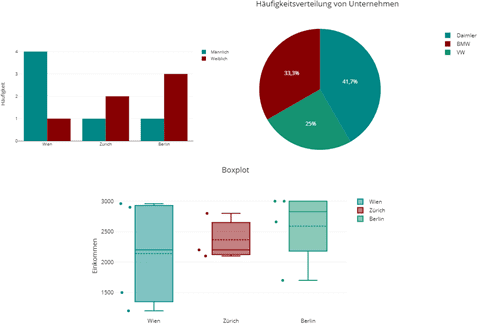
Create charts online with DATAtab
Create your charts for your data directly online and uncomplicated. To do this, insert your data into the table under Charts and select which chart you want.
Create charts onlineThe advantages of DATAtab
Statistics, as simple as never before.
DATAtab is a modern statistics software, with unique user-friendliness. Statistical analyses are done with just a few clicks, so DATAtab is perfect for statistics beginners and for professionals who want more flow in the user experience.
Directly in the browser, fully flexible.
Directly in the browser, fully flexible. DATAtab works directly in your web browser. You have no installation and maintenance effort whatsoever. Wherever and whenever you want to use DATAtab, just go to the website and get started.
All the statistical methods you need.
DATAtab offers you a wide range of statistical methods. We have selected the most central and best known statistical methods for you and do not overwhelm you with special cases.
Data security is a top priority.
All data that you insert and evaluate on DATAtab always remain on your end device. The data is not sent to any server or stored by us (not even temporarily). Furthermore, we do not pass on your data to third parties in order to analyze your user behavior.
Many tutorials with simple examples.
In order to facilitate the introduction, DATAtab offers a large number of free tutorials with focused explanations in simple language. We explain the statistical background of the methods and give step-by-step explanations for performing the analyses in the statistics calculator.
Practical Auto-Assistant.
DATAtab takes you by the hand in the world of statistics. When making statistical decisions, such as the choice of scale or measurement level or the selection of suitable methods, Auto-Assistants ensure that you get correct results quickly.
Charts, simple and clear.
With DATAtab data visualization is fun! Here you can easily create meaningful charts that optimally illustrate your results.
New in the world of statistics?
DATAtab was primarily designed for people for whom statistics is new territory. Beginners are not overwhelmed with a lot of complicated options and checkboxes, but are encouraged to perform their analyses step by step.
Online survey very simple.
DATAtab offers you the possibility to easily create an online survey, which you can then evaluate immediately with DATAtab.
Our references
Alternative to statistical software like SPSS and STATA
DATAtab was designed for ease of use and is a compelling alternative to statistical programs such as SPSS and STATA. On datatab.net, data can be statistically evaluated directly online and very easily (e.g. t-test, regression, correlation etc.). DATAtab's goal is to make the world of statistical data analysis as simple as possible, no installation and easy to use. Of course, we would also be pleased if you take a look at our second project Statisty.
Extensive tutorials
Descriptive statistics
Here you can find out everything about location parameters and dispersion parameters and how you can describe and clearly present your data using characteristic values.
Hypothesis Test
Here you will find everything about hypothesis testing: One sample t-test, Unpaired t-test, Paired t-test and Chi-square test. You will also find tutorials for non-parametric statistical procedures such as the Mann-Whitney u-Test and Wilcoxon-Test. mann-whitney-u-test and the Wilcoxon test
Regression
The regression provides information about the influence of one or more independent variables on the dependent variable. Here are simple explanations of linear regression and logistic regression.
Correlation
Correlation analyses allow you to analyze the linear association between variables. Learn when to use Pearson correlation or Spearman rank correlation. With partial correlation, you can calculate the correlation between two variables to the exclusion of a third variable.
Partial Correlation
The partial correlation shows you the correlation between two variables to the exclusion of a third variable.
Levene Test
The Levene Test checks your data for variance equality. Thus, the levene test is used as a prerequisite test for many hypothesis tests.
p-Value
The p-value is needed for every hypothesis test to be able to make a statement whether the null hypothesis is accepted or rejected.
Distributions
DATAtab provides you with tables with distributions and helpful explanations of the distribution functions. These include the Table of t-distribution and the Table of chi-squared distribution
Contingency table
With a contingency table you can get an overview of two categorical variables in the statistics.
Equivalence and non-inferiority
In an equivalence trial, the statistical test aims at showing that two treatments are not too different in characteristics and a non-inferiority trial wants to show that an experimental treatment is not worse than an established treatment.
Causality
If there is a clear cause-effect relationship between two variables, then we can speak of causality. Learn more about causality in our tutorial.
Multicollinearity
Multicollinearity is when two or more independent variables have a high correlation.
Effect size for independent t-test
Learn how to calculate the effect size for the t-test for independent samples.
Reliability analysis calculator
On DATAtab, Cohen's Kappa can be easily calculated online in the Cohen’s Kappa Calculator. there is also the Fleiss Kappa Calculator. Of course, the Cronbach's alpha can also be calculated in the Cronbach's Alpha Calculator.
Analysis of variance with repeated measurement
Repeated measures ANOVA tests whether there are statistically significant differences in three or more dependent samples.
Cite DATAtab: DATAtab Team (2024). DATAtab: Online Statistics Calculator. DATAtab e.U. Graz, Austria. URL https://datatab.net
