Descriptive Statistics Calculator
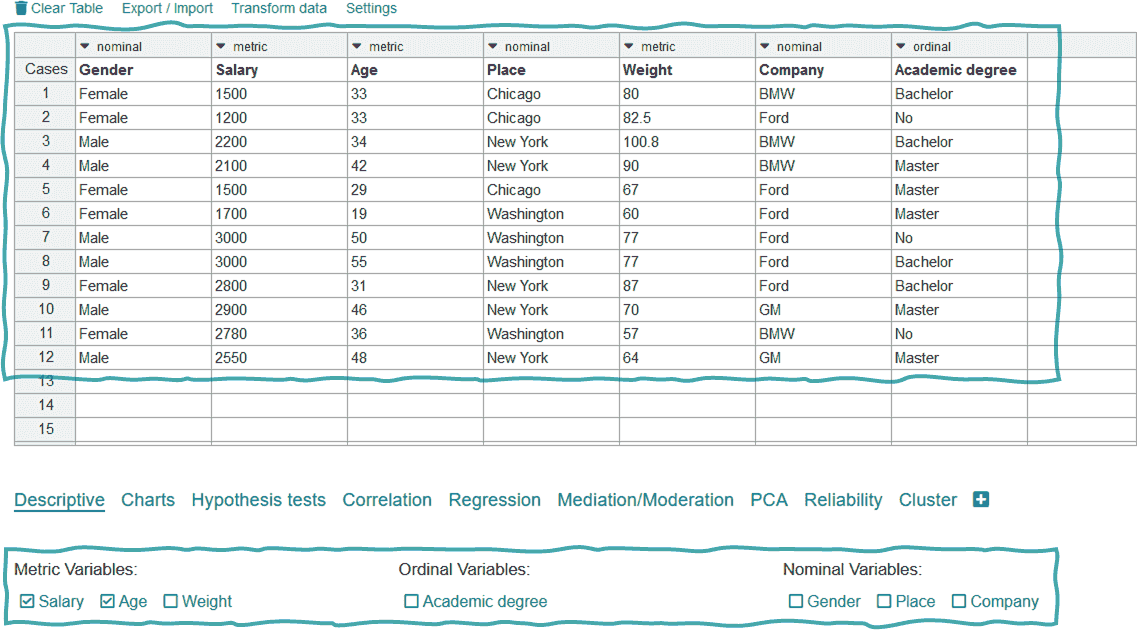
With this statistical analysis tool you can easily analyse your data online. On this tab you can analyse your data descriptively. To calculate descriptive statistics such as the standard deviation or the mean value, simply select the desired variable.

If you want to use your own data, simply delete the table and copy in your own data that you want to analyse descriptively. Then simply select the variables.
- Clear the table in the Descriptive Statistics Calculator.
- Copy the data from which you want to calculate the standard deviation and mean value into the table.
- Select the variable
- Select standard deviation and mean value
You will then receive a table with the calculated standard deviation and the mean value of your data. Now you know how strongly your data scatter and where the expected value of your data lies.
What are Descriptive Statistics?
Descriptive statistics summarise your data using numerical calculations. Examples of descriptive statistics are:
- Mean
- Standard Deviation
- Quartiles
- frequency tables
- Contingency tables
This statistical analysis tool generates descriptive statistics for your data set easily online. Just try it out!
Calculate standard deviation online
With it you can easily calculate the standard deviation online. You can then copy the result, along with many other descriptive parameters, into your thesis.
Descriptive statistics
Would you like to describe your data accurately? Then select one or more variables and decide on the available measures in the area of descriptive statistics.
Mean, median, mode
Are you interested in the location of your data? Select one or more variables and click on Mean, Median or Mode to capture the central trend of your data.
Standard deviation, variance & span
Are you interested in measuring the dispersion of your data? Then select one or more metric variables and decide on the variance, standard deviation, range or minimum and maximum of the distribution.
Frequency table
Do you want to present your data using frequency tables? Then select one or more variables and gain relevant insights into your data.
Contingency table
Would you like to present your data using contingency tables? Then select two relevant variables and obtain the absolute or relative frequencies of combinations of certain characteristic values.
Histogram
Would you like to display your data graphically using histograms? Then select one or more variables that contain the frequencies of combinations of certain characteristic values.
Bar chart
Would you like to present your data using bar charts? Select one or more relevant variables and DATAtab will automatically create a bar chart if the scale level is ordinal or nominal.
Variance calculator
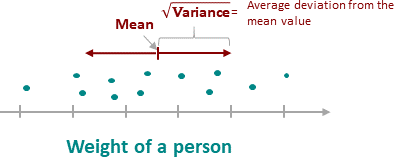
The variance is one of the most important variables in descriptive statics. In the variance calculator, you can easily display the variance or standard deviation of your data. The standard deviation indicates how large the average deviation from the mean value is for your data. The variance is the root of the standard deviation.

Calculate sample variance
It is assumed that your data are samples, therefore the sample variance is calculated by default in the variance calculator. You can also display the standard deviation for the population.
Median calculator
Of course, it is also very easy to calculate the median online with DATAtab. To do this, simply click on Calculate median after you have selected your variable. The calculated median then also appears in the table.
DATAtab is also available in German, French and Spanish. Visit the Deskriptive Statistiken Rechner on the German page, the Calculateur de statistiques descriptives on the French page or the Calculadora de estadísticas descriptivas on the Spanish page.